
The figures behind this report
Complete responses returned by openFDA for the two specified monthly cohorts. September and October use the same inclusion field: report date. Source releases: 2026-11-11 and 2026-11-11. Retrieved November 20, 2026 (Asia/Kuala Lumpur).
| Measure | September 2026 | October 2026 |
|---|---|---|
| Recall product records | 278 | 337 |
| Distinct recall event IDs within month | 101 | 101 |
| Distinct recalling-firm strings | 69 | 86 |
| Class I records | 30 | 18 |
| Class II records | 248 | 308 |
| Class III records | 0 | 11 |
Counts describe this dataset and snapshot. Applicant and firm names are exact source strings, without parent-company consolidation. Event totals are distinct within each month; the same event may appear in both monthly cohorts.
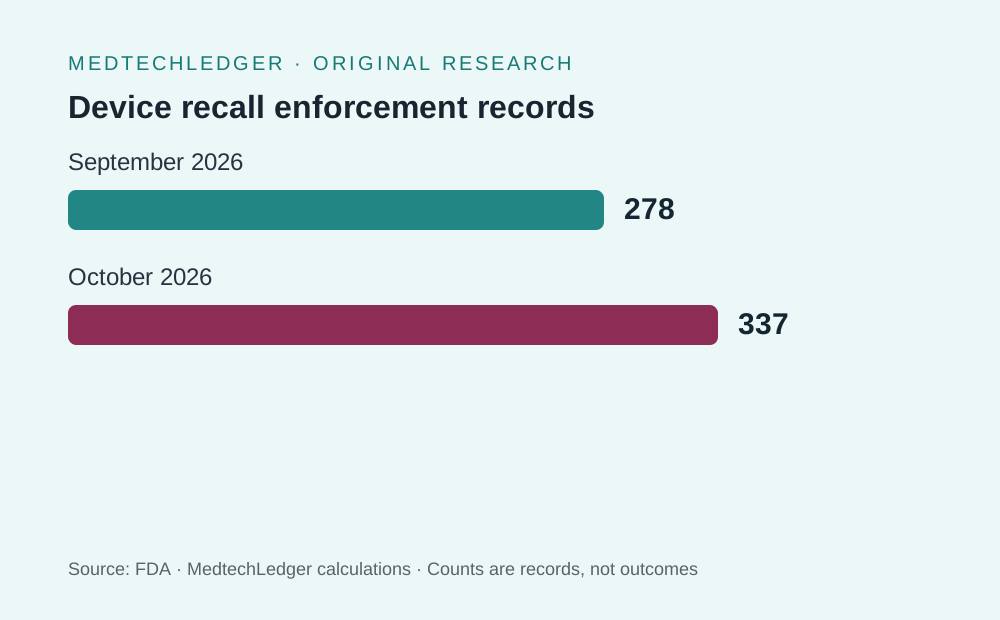
October 2026 produced 337 FDA medical-device enforcement records in the report-date cohort, versus 278 in September, based on MedtechLedger’s complete openFDA pulls by report_date. That is a report publication comparison, not a count of recalls initiated in those months. The two cohorts each contain 101 event IDs, so the month-to-month contrast sits in the number of records per event, the number of recalling firms, and the class mix—not in event count alone [1][2][5][6][8].
What the October cohort actually counts
MedtechLedger defined the October cohort by report_date from 2026-10-01 through 2026-10-31 and retrieved 337 rows from the openFDA enforcement API snapshot on 2026-11-19. The FDA source update date used in the analysis is 2026-11-11, and the analysis file is identified as /data/research/fda-enforcement-october-2026.csv [1]. The September comparator uses report_date from 2026-09-01 through 2026-09-30, retrieved on the same day from the corresponding FDA snapshot updated 2026-11-11, with a CSV at /data/research/fda-enforcement-september-2026.csv [2].
Recall events are equal, records are not
The most important guardrail in this comparison is that each month has 101 event IDs, even though the record totals differ. FDA’s API definitions identify recalleventid as the numerical designation for a specific recall event, while recallnum is the separate system-generated identifier for a specific classified recalled product [8]. That distinction matters because one event can map to more than one product-level record, and the report view itself is organized to support product, event, print, and CSV views [3][8].
In October, 337 records spread across 101 events and 86 firms; in September, 278 records also spread across 101 events and 69 firms [1][2]. Because event count is unchanged, the report-date comparison is about average record density per event and the spread across firms, not about a larger number of distinct recall events appearing in October. The underlying FDA pages also warn that the reporting date reflects when FDA classified or posted the action, not necessarily when the recall began [5][6].
Suggested verification workflow
Check the query window, then confirm the row count, event count, firm count, and class counts in the MedtechLedger calculation block for each month. Then confirm that recalleventid and recallnum are different fields in FDA’s API definitions, and that the report date reflects publication/classification timing rather than recall initiation [1][2][5][6][8]. If any later analysis uses product-level rows, it should say so explicitly, because the same event ID can appear in more than one product record.
Why the month-over-month comparison should stay narrow
The openFDA overview says the device enforcement feed is based on FDA’s Recall Enterprise System and is updated weekly, while the FDA recall page says the posting date or create date is the date FDA classified the recall and does not necessarily mean the recall is new [5][6]. That makes the report-date cohort a publication activity series, not an initiation series. MedtechLedger therefore treated the monthly slices as source snapshots, not as evidence of when firms first notified customers or when the underlying problem began [1][2][5][6].
The FDA’s definitions also separate status from timing. The enforcement report includes Class I, II, III, and not-yet-classified entries, and the medical-device recall page says the status field may remain unchanged after publication because FDA does not update status after classification [3][6]. In the October cohort, all 337 records are marked Ongoing, while September has 278 Ongoing records [1][2]. That status alignment is useful for description, but it does not establish recall duration trends or recall effectiveness.
Class mix and what it can, and cannot, say
October’s class distribution is 308 Class II, 18 Class I, and 11 Class III records [1]. September’s distribution is 248 Class II and 30 Class I records, with no Class III records in the cited snapshot [2]. The class labels come from FDA’s recall classification framework, where Class I means a reasonable probability of serious adverse health consequences or death, Class II means temporary or medically reversible adverse health consequences or remote probability of serious harm, and Class III means adverse health consequences are not likely [3][4][7].
That mix is a descriptor of how FDA classified the records in each monthly snapshot, not a causal safety trend. The FDA itself says recall classification can occur after the firm has already begun notifying consignees, and openFDA says not all recalls are announced publicly before they appear in the report [5][6]. So the October increase in Class III records should not be read as a shift in underlying product risk without a product-level review outside this report-date slice.
Firm counts moved more than event counts
The firm count rose from 69 in September to 86 in October [1][2]. Because the event count stayed at 101 in both months, the higher firm count indicates that October’s published records were distributed across more recalling firms, not that there were more events. FDA’s database definitions identify the recaller field as the original recalling firm name, which is a firm-level attribute separate from event ID and recall number [8].
This is one reason product-level recall numbers, event IDs, and recalling-firm strings should stay separate in analysis. A month can show more records with the same event count if existing events generate multiple product records or if more firms appear across the published set. The monthly counts do not support a claim that October was “worse” or “better”; it only supports a different publication pattern in the monthly snapshot [1][2][8].
How to read the report-date method without overreach
FDA’s general recall manual says medical device recalls may arise from manufacturing defects, labeling deficiencies, premarketing nonconformance, packaging defects, and other nonconformance problems, but the monthly report-date totals alone do not identify which of those drivers are behind the counts [4]. The same page also says the public Enforcement Report follows classification, and the FDA recall page says the posting date is tied to classification, not necessarily initiation [4][5].
For that reason, the right question for this dataset is narrow: how did the published monthly snapshot differ by records, events, firms, and class labels? It is not valid to infer injury rates, patient advice, market share, unit totals, or a multi-month safety trajectory from these figures. Those topics are outside these monthly counts and outside the cohort design [1][2][5][6].
Practical detail: a traceable way to audit the cohort
A useful audit pattern is to verify three items together for each month: the report_date window used in the API query, the retrieval timestamp, and the source update date published in the source record. For October, those are 2026-10-01 to 2026-10-31, retrieval on 2026-11-19T20:54:32.469689+00:00, and FDA source release 2026-11-11; for September, they are 2026-09-01 to 2026-09-30, retrieval on 2026-11-19T21:00:46.505757+00:00, and the same source release date [1][2].
If a reader wants to reproduce the comparison, the relevant CSVs are named in the data downloads, and the analysis should stay at the report-date level rather than mixing in initiation_months. MedtechLedger’s own calculation blocks provide the denominators, event counts, firm counts, and class counts used here; the FDA pages provide the field definitions that keep event ID, recall number, status, and recall initiation date from being conflated [1][2][8].
Sources & references
- MedtechLedger calculation from the complete FDA october 2026 enforcement response · api.fda.gov
- MedtechLedger calculation from the complete FDA september 2026 enforcement response · api.fda.gov
- Enforcement Report Information and Definitions | FDA · www.fda.gov
- FDA Investigations Operations Manual 2026 — Chapter 7 Recall Activities · www.fda.gov
- Medical Device Recalls · www.accessdata.fda.gov
- Device Enforcement Overview · open.fda.gov
- Recalls, Corrections and Removals (Devices) | FDA · www.fda.gov
- Enforcement Report API Definitions | FDA · www.fda.gov